Evaluation
This section reports the evaluation of FANTASIA v4.0 on the CAFA3 benchmark. Results are presented both per model and aggregated, following the official CAFA-evaluator methodology.
Data availability
All prediction files, evaluation outputs, and ground truth references used in this study are openly available in Zenodo:
FANTASIA v4.0 Results on CAFA3 Evaluation
This record includes:
fantasia_results_cafa3.zip— Predicted annotations generated with FANTASIA.cafa3_evaluation.zip— Processed evaluation outputs.cafa3_gt.tsv— Ground truth annotations.cafa3_gt.fasta— Ground truth protein sequences.
Fmax scores
The main evaluation metric is Fmax, computed separately for each model and aggregation strategy:
Model |
Fmax |
|---|---|
Prot-T5 |
0.822 |
ESM3c |
0.815 |
Ankh3-Large |
0.810 |
all_models |
0.810 |
Prost-T5 |
0.809 |
ESM |
0.800 |
ensemble |
0.791 |
Note
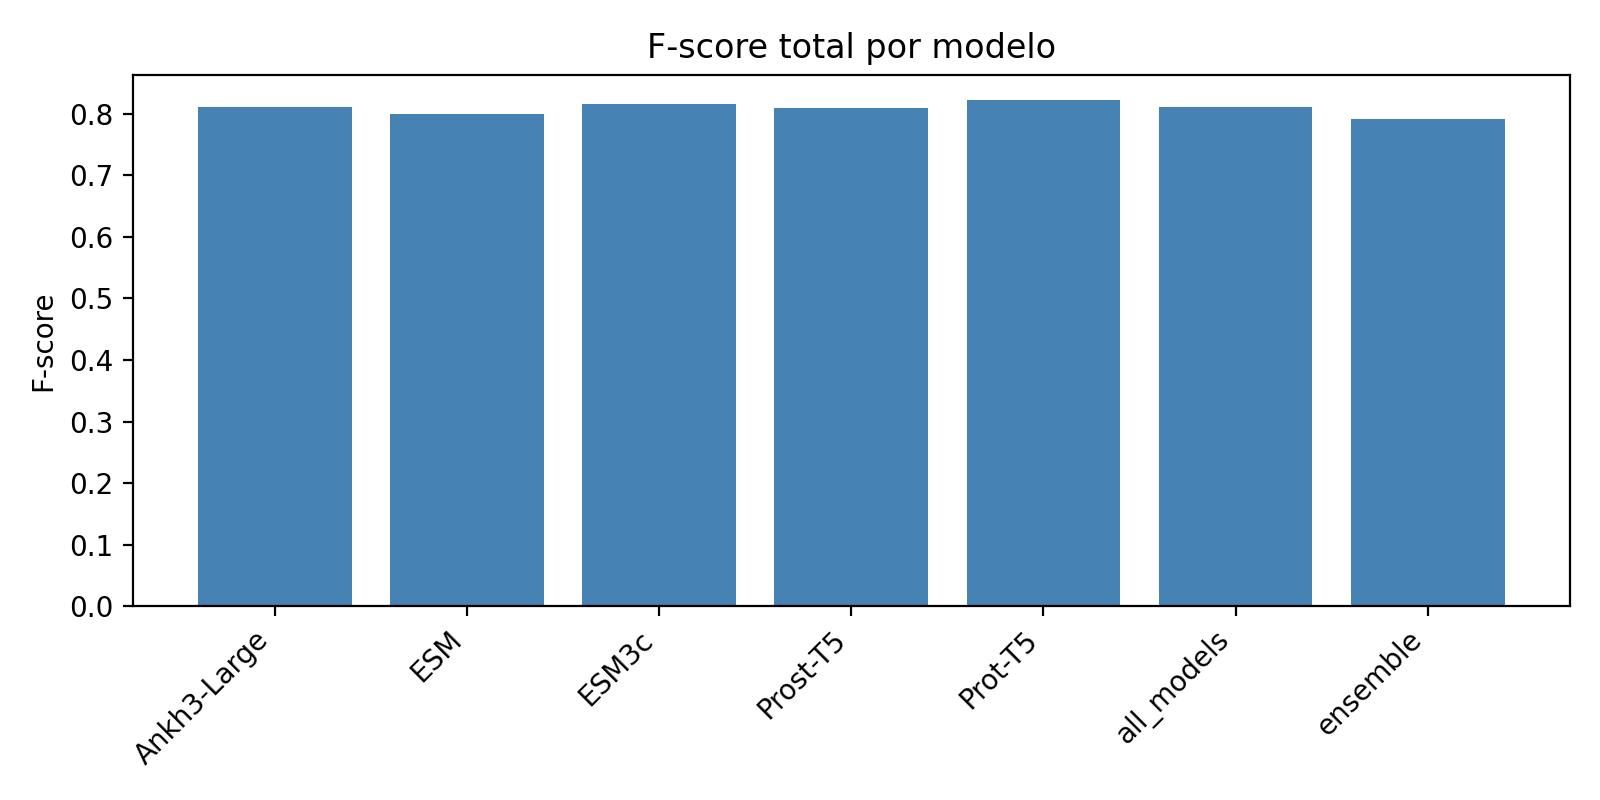
Prot-T5 achieved the highest Fmax (0.822), followed closely by ESM3c (0.815). The ensemble strategy performed slightly worse than the best individual models.
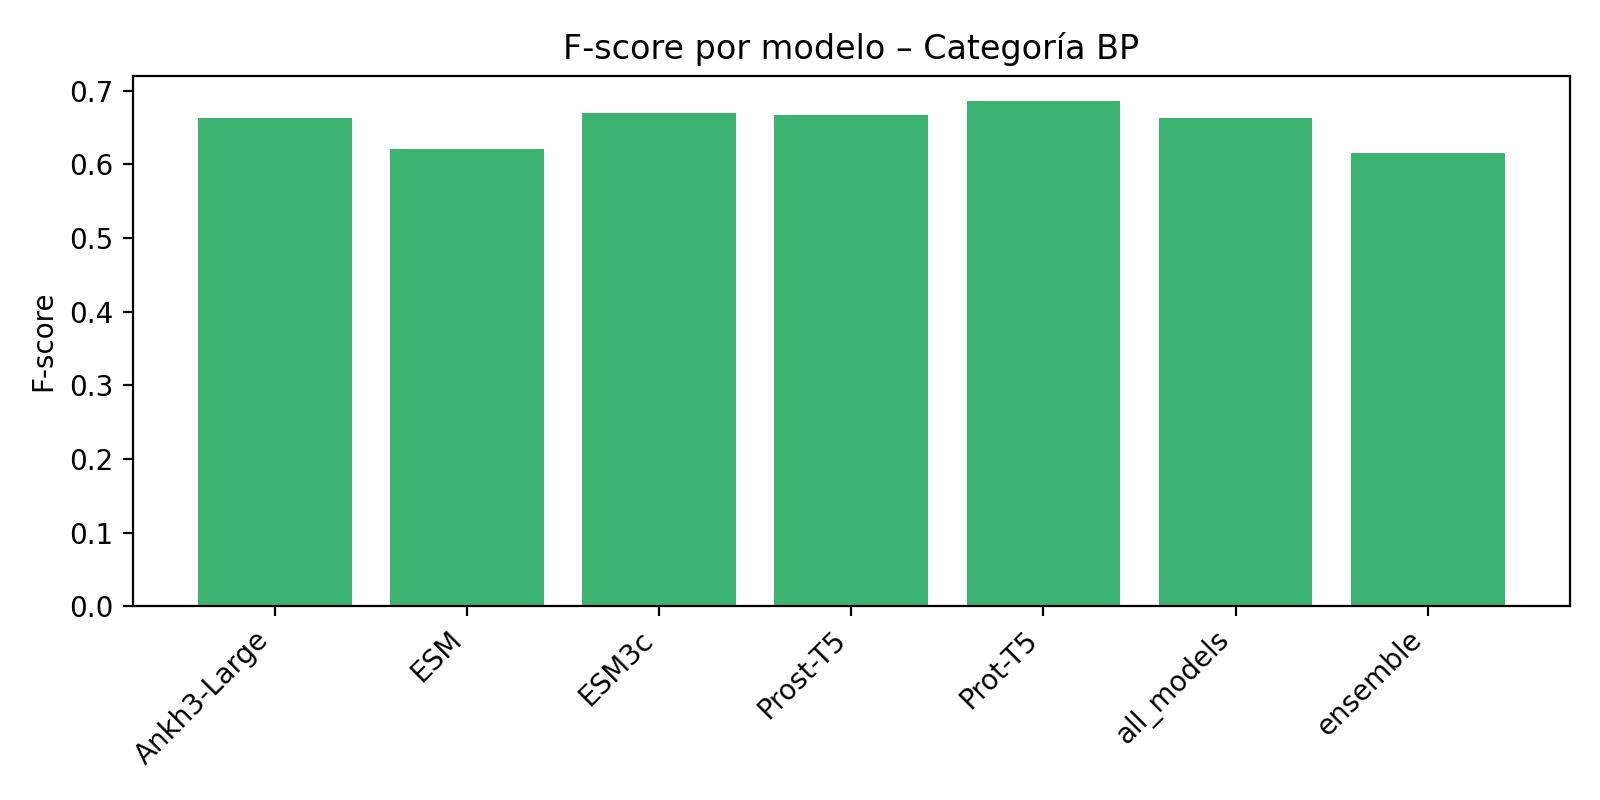
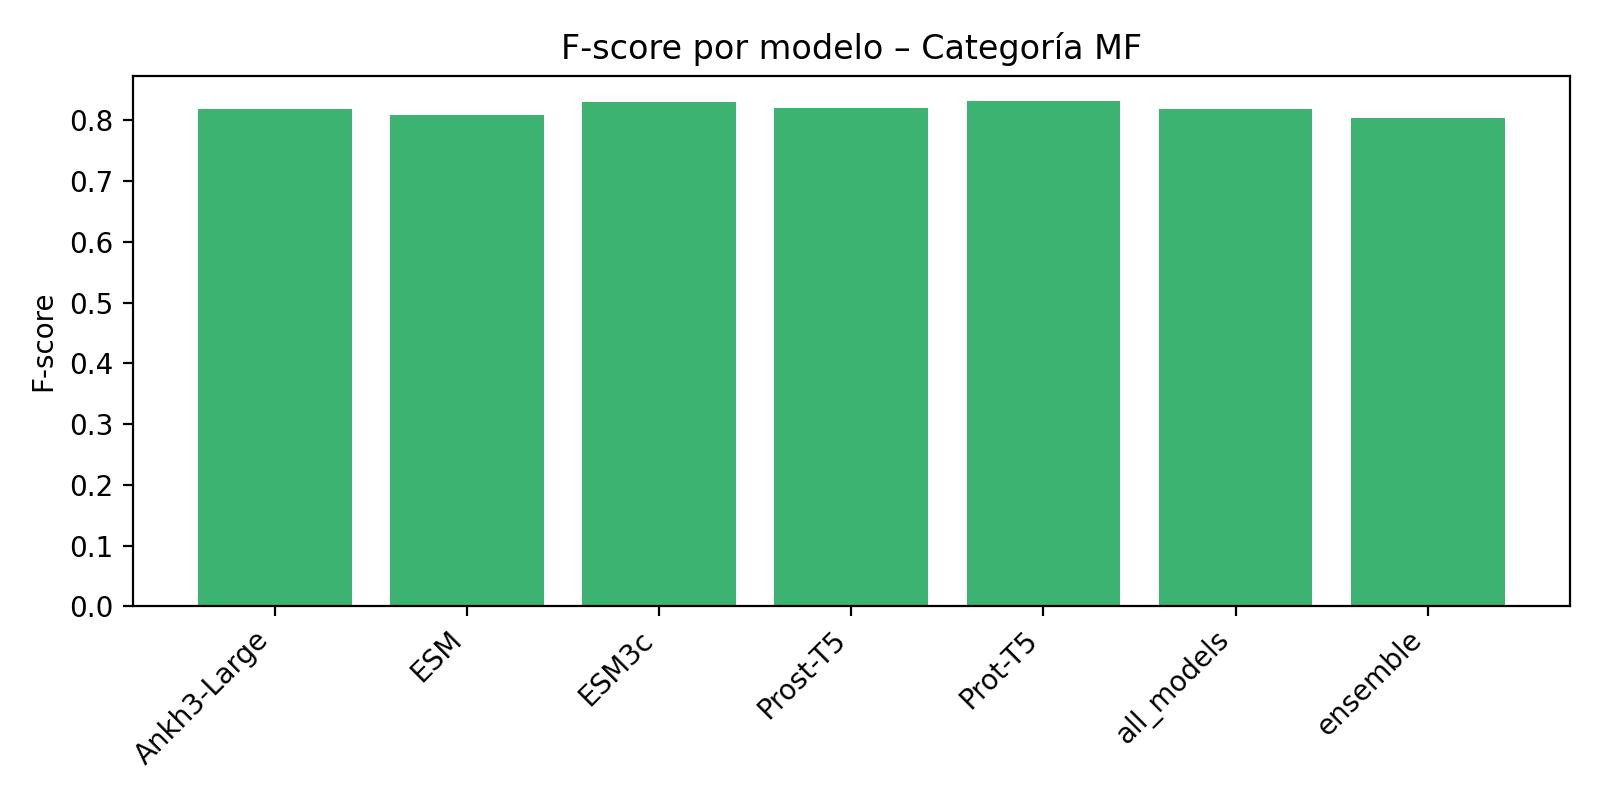
Per-ontology performance
The following figures illustrate F-score distributions by ontology category:
BP (Biological Process):
CC (Cellular Component):

MF (Molecular Function):
Overall F-score
The aggregated F-scores across all ontology categories are summarized below:
all_models vs ensemble
It is important to distinguish between the two aggregation strategies:
Ensemble (FANTASIA internal): Combines predictions from all enabled models, but for each protein keeps only the annotation with the best score. This favors high-confidence transfer at the cost of discarding secondary annotations.
All models (external CAFA evaluation): Brute-force evaluation of all prediction files (per-model outputs and the ensemble together). This effectively merges all annotations, leading to broader coverage but also potential redundancy.
Interpretation
Individual PLMs (especially Prot-T5 and ESM3c) outperform the internal ensemble in terms of Fmax.
The internal ensemble achieves higher recall (0.86–0.93) but at the cost of lower precision (0.51–0.73), which explains its lower Fmax compared to the best single models.
In contrast, the all_models evaluation (performed externally with the CAFA evaluator) merges predictions from all PLMs, including also the ensemble, providing an upper bound of annotation capacity with even broader coverage but also introducing redundancy, and therefore is not directly comparable to the internal ensemble.